logo  logo - go to homepage
  • Documentation
  • Downloads
  • FAQ
  • View on GitHub
  • Downloads
    • Install and Run
    • Building from Source
    • Docker
  • Core Concepts
  • Backends
    • In Memory
    • H2
    • Postgres
    • Cassandra
    • Astra
  • Configuration Reference
    • Reaper Specific Settings
    • Backend Specific Settings
    • Docker Variables
    • Shiro Authentication
  • Metrics
    • Dashboards
    • Graphite Reporter
    • Prometheus
  • Using Reaper
    • Adding a Cluster
    • Checking a Cluster's Health
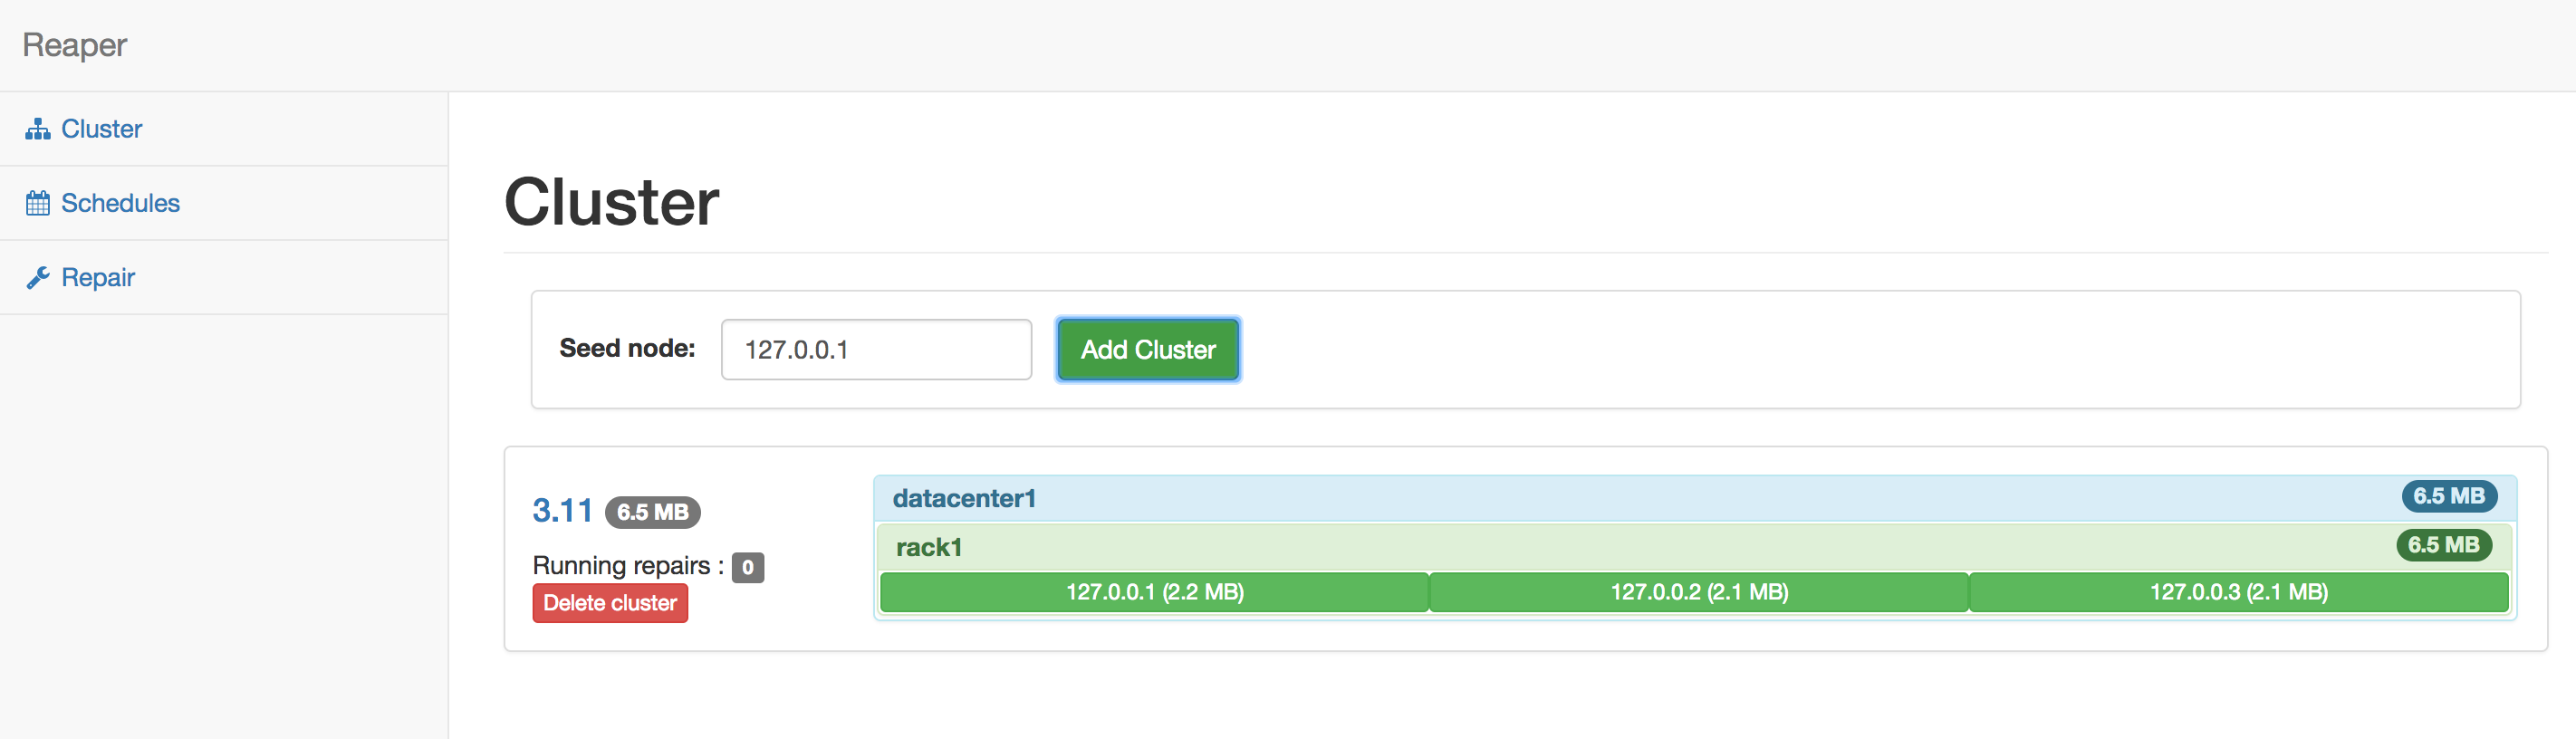
    • Running a Cluster Repair
    • Scheduling a Cluster Repair
    • Multi DCs with One Reaper
    • Multi DCs with Multi Reapers
    • Sidecar Mode
    • Cassandra Diagnostic Events
  • Rest API
  • Community
  • Development

Checking a Cluster’s Health

Dashboard

When a cluster has been added to Reaper it will be displayed in the dashboard.
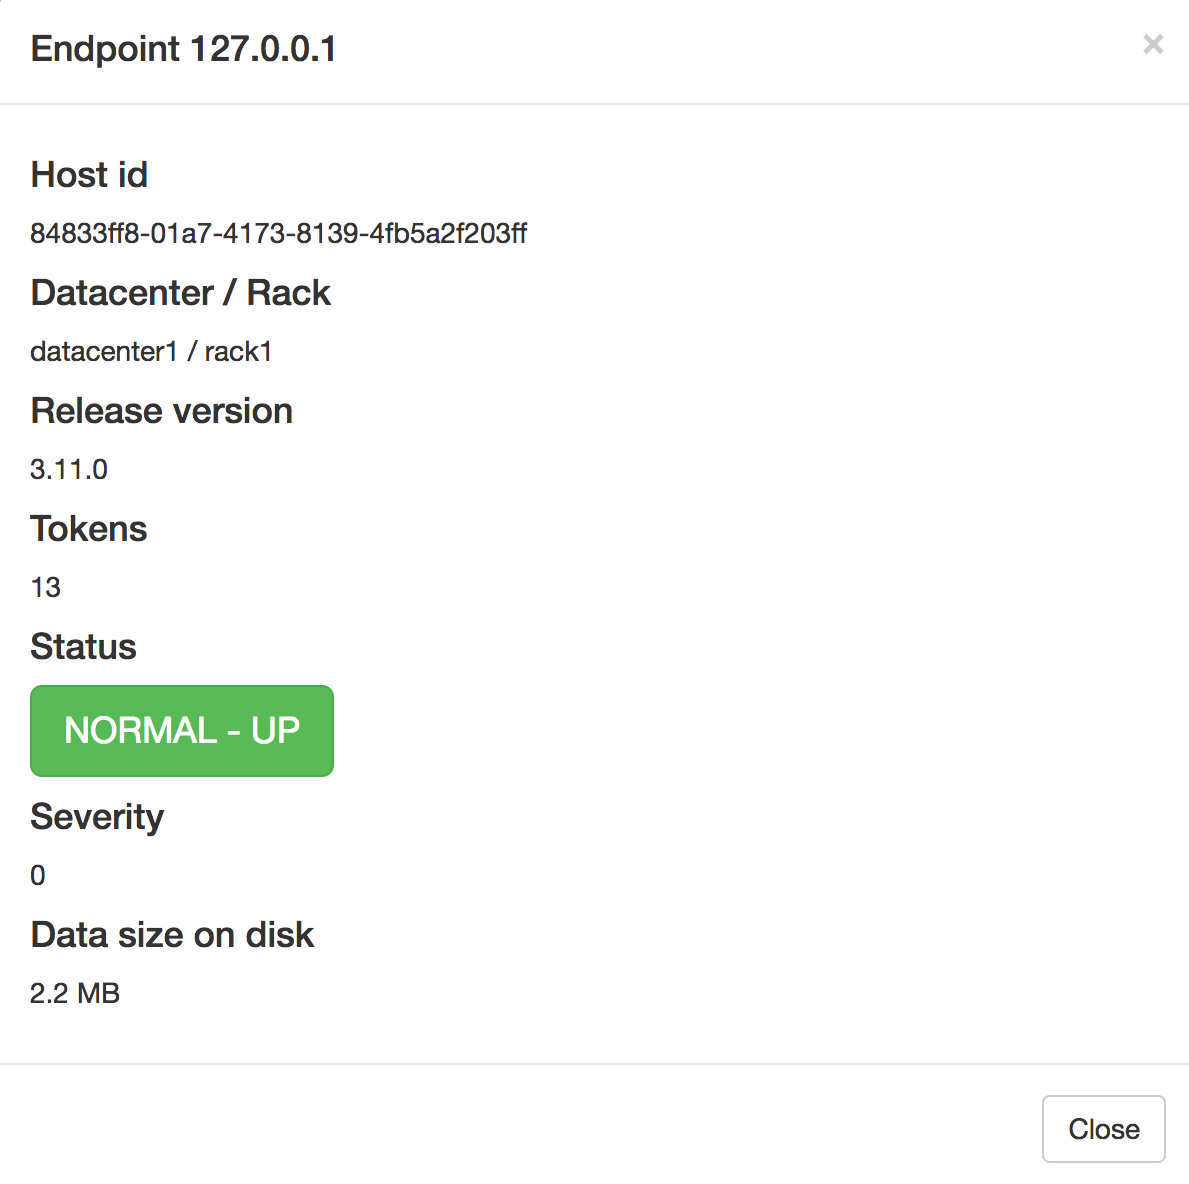
Node View

Clicking on one of the nodes will open a dialog box containing details of the node’s state.

Template by Bootstrapious. Ported to Hugo by DevCows